
Three Market Views Worth Watching This Week
The Quant Atlas Brief: Weekly Market Views from a Quant Platform

Each week, Quant Atlas scans global markets through multiple model layers.
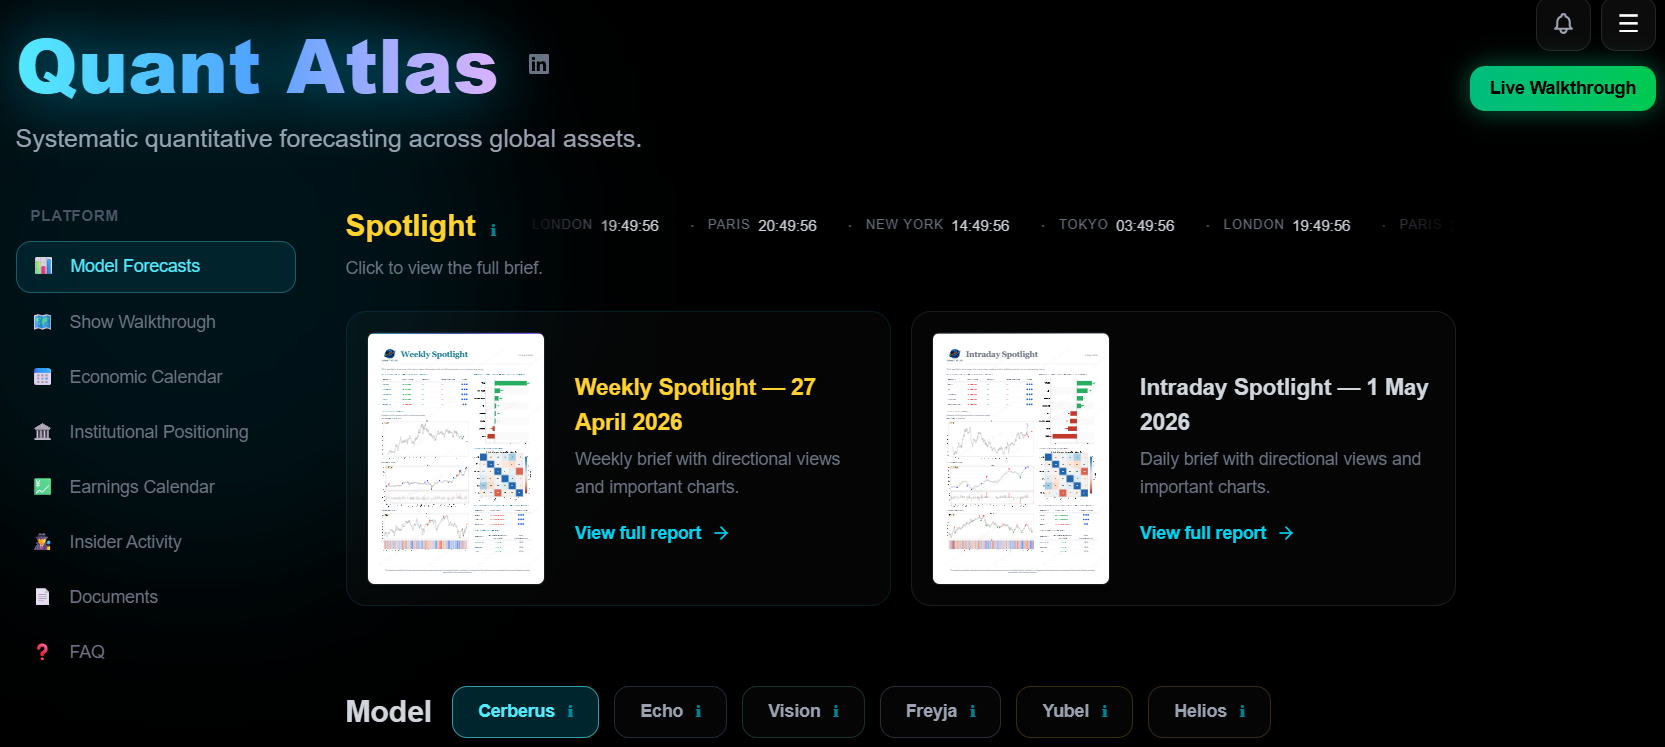
Quant Atlas is a model driven market forecasting platform that scans global assets across price structure, momentum, divergence, and pattern recognition in search for conviction.
The goal is not to chase every move. The goal is to identify interesting plays.
This week, three markets stand out.
1. EURGBP
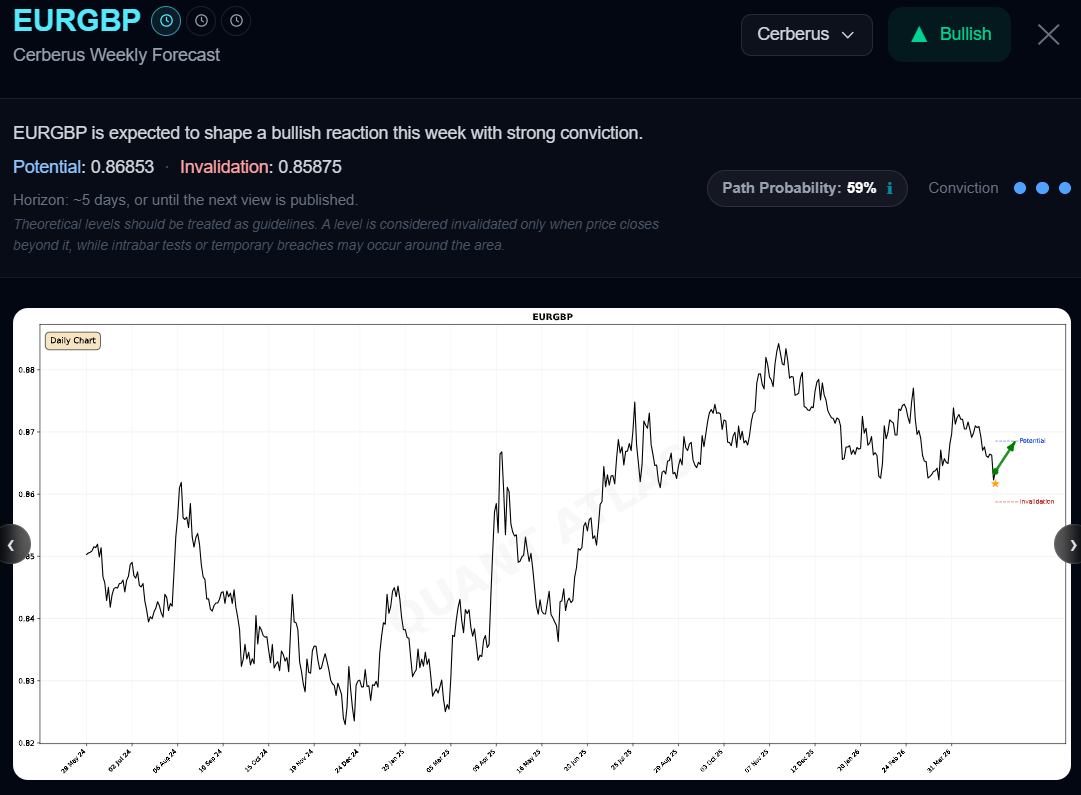
The first view comes from the Cerberus model with a strong conviction for a recovery this week.
The interesting part is not only the directional bias. It is the context behind it: price structure, confirmation signals, and the horizontal technical support around the current levels.
2. S&P 500 (SPX)
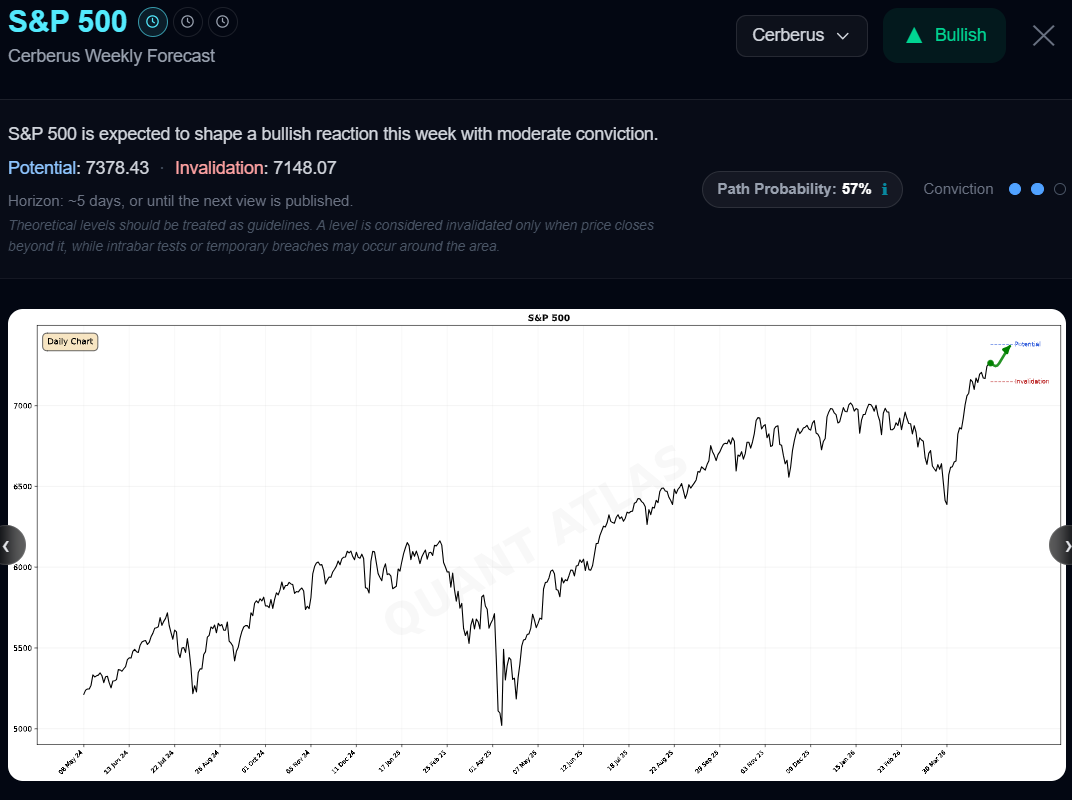
The second view also comes from the Cerberus model with a moderate conviction for a bullish continuation on SPX this week.
3. EURCAD
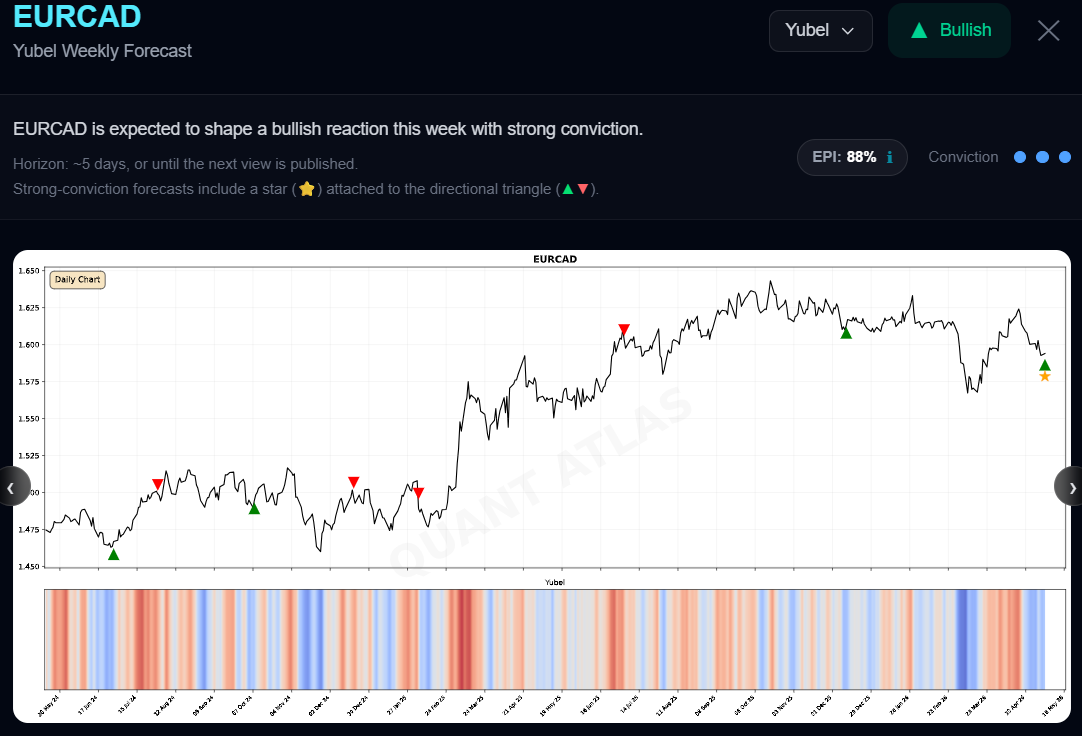
The third view comes from the Yubel model with a strong conviction for a bullish recovery on EURCAD this week.
This bearish momentum seems to be exhausted and ready to reverse for a few days.
The Atlas Brief gives selected market views. Quant Atlas gives the full model context behind them (170+ global assets across 5 different models through the lenses of 2 time horizons).
Start your Free trial now for the full picture:
Optional Section: Why You NEED Quant Atlas
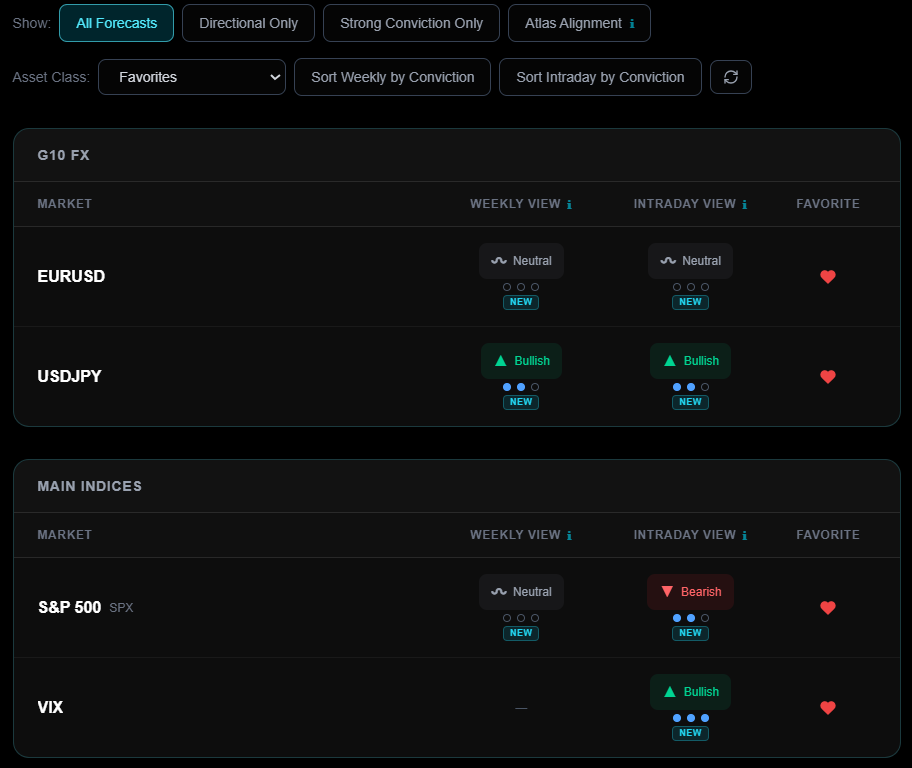
Quant Atlas provide timely forecasts for more than 170 global assets (FX, EM, IX, cryptos, stocks, rates, and commodities). Forecasts are ranked by conviction and strong conviction views are pushed onto subscribers through a notification system.
Forecasts are published on the website in the form of charts. Since there are 5 forecasting models (each targeting a specific segment of price action), Quant Atlas operates on a conviction and alignment system.
The conviction system: Every model is independent and carries a conviction score between 0 and 3, with 0 symbolizing a neutral view and 3 symbolizing a strong conviction (bullish/bearish).
The alignment system: Models that have the same view on the same asset are said to be aligned, which enhances the directional conviction on a specific market.
Here’s a quick overview of each model:
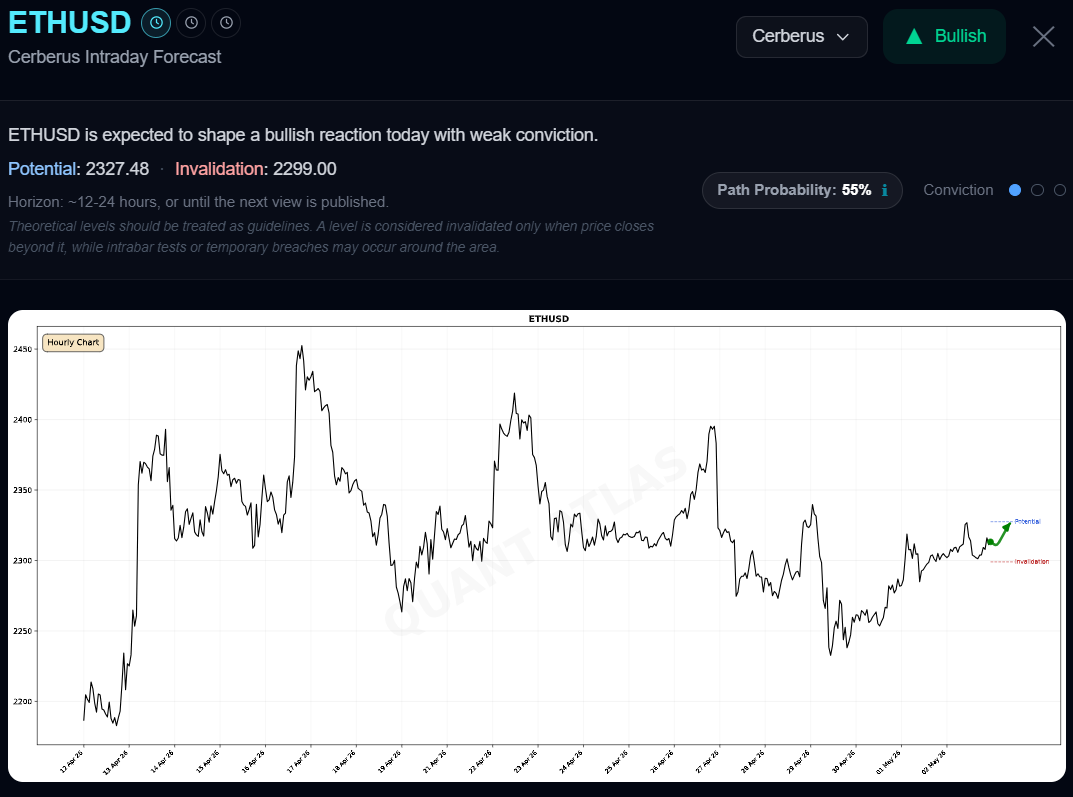
Cerberus: The main price forecasting engine that presents a chart with a directional arrow and potential/invalidation levels.
Echo: A volatility forecasting engine that presents a chart with a directional arrow and a potential level.
Vision: A directional confirmation model that uses a smart aggregation of multiple technical tools and techniques to deliver a chart with a directional bias.
Freyja: A directional confirmation model that uses market timing and pattern recognition to deliver a chart with a directional bias.
Yubel: A directional confirmation model that uses trend exhaustion detection tools to deliver a chart with a directional bias.
There are two types of time horizons. We publish Weekly views (once per week on Mondays with a forecasting life span of around 5 days) and Intraday views (once per day with a forecasting life span of 12-24 hours). Weekly views use Daily bars in the charts and Intraday views use Hourly bars in the charts.
The frequency of publication is regular. Weekly views are published early in the morning NY time and intraday views are published around 7:00 AM NY time every day.
A Spotlight is there to summarize the views and show some interesting charts. It’s a quick read if you don’t have enough time to go through the whole list of markets.
You will also find market intelligence tools on the website such as:
Institutional positioning,
Insider activity,
Earnings calendar,
Seasonality charts,
Breadth indicators,
Seasonality returns table,
Start your Free trial now for the full picture: