

Every day, Quant Atlas scans 150+ global markets and searches for result-driven strong conviction forecasts.
The goal is not to chase every move. The goal is to identify interesting plays.
🚨🚨Access cutting-edge market forecasts!
Our platform, Quant Atlas has a 10-day Free trial now, so you can check out daily forecasts of 150+ markets ranked by conviction!
At Quant Atlas, we regularly publish free research articles covering a wide range of topics in quantitative finance.
Each article is grounded in quantitative analysis and designed to be both informative and enjoyable to read. We explore market behaviour, systematic methods, indicators, forecasting, risk, and other areas of applied quantitative research.
We currently have around 12 articles available, with more being added regularly. In several of them, we also share elements of our methodology, research process, and the reasoning behind our models.
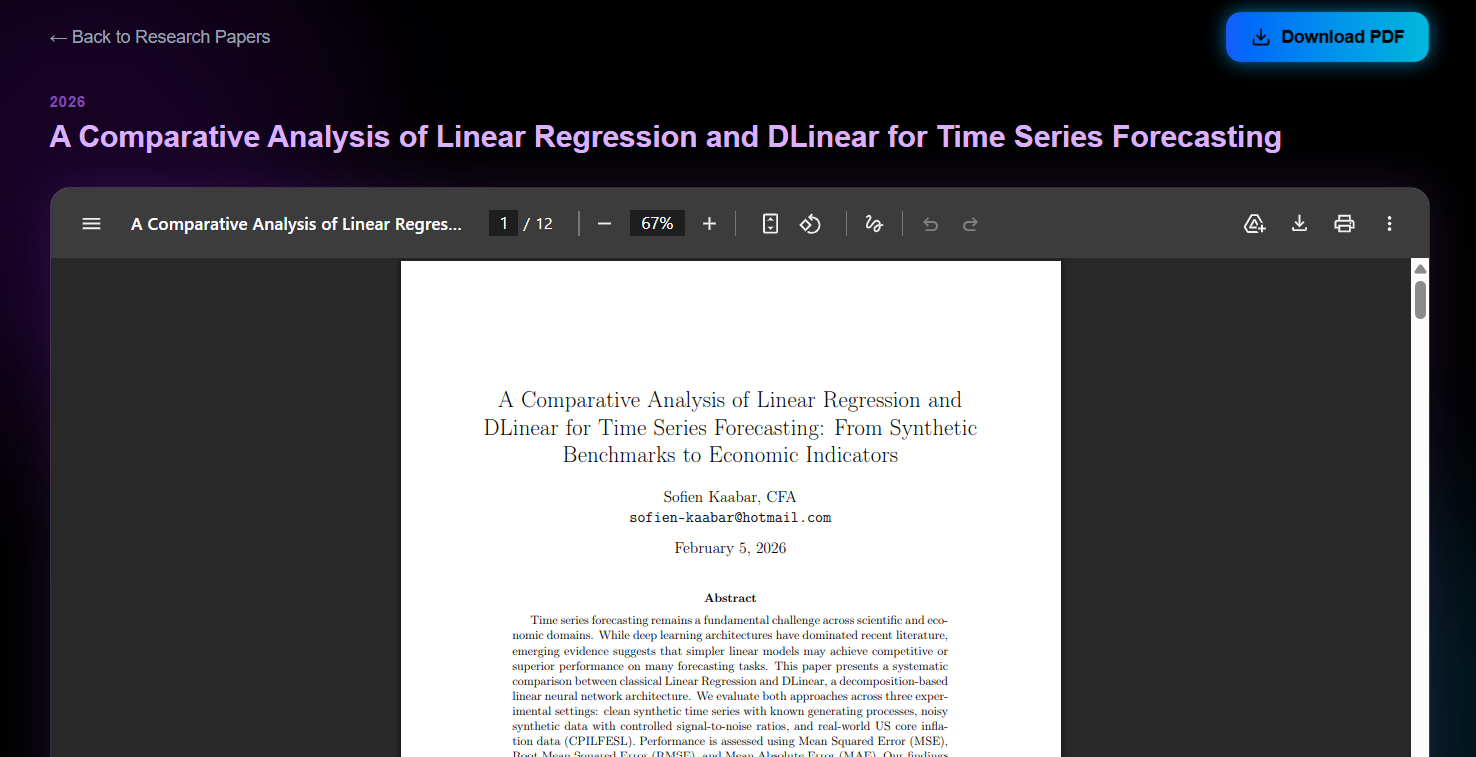
All articles are completely free. You can read them directly on the Quant Atlas website or download them as PDFs for later.
Explore the research library and discover a practical, research-driven perspective on financial markets.
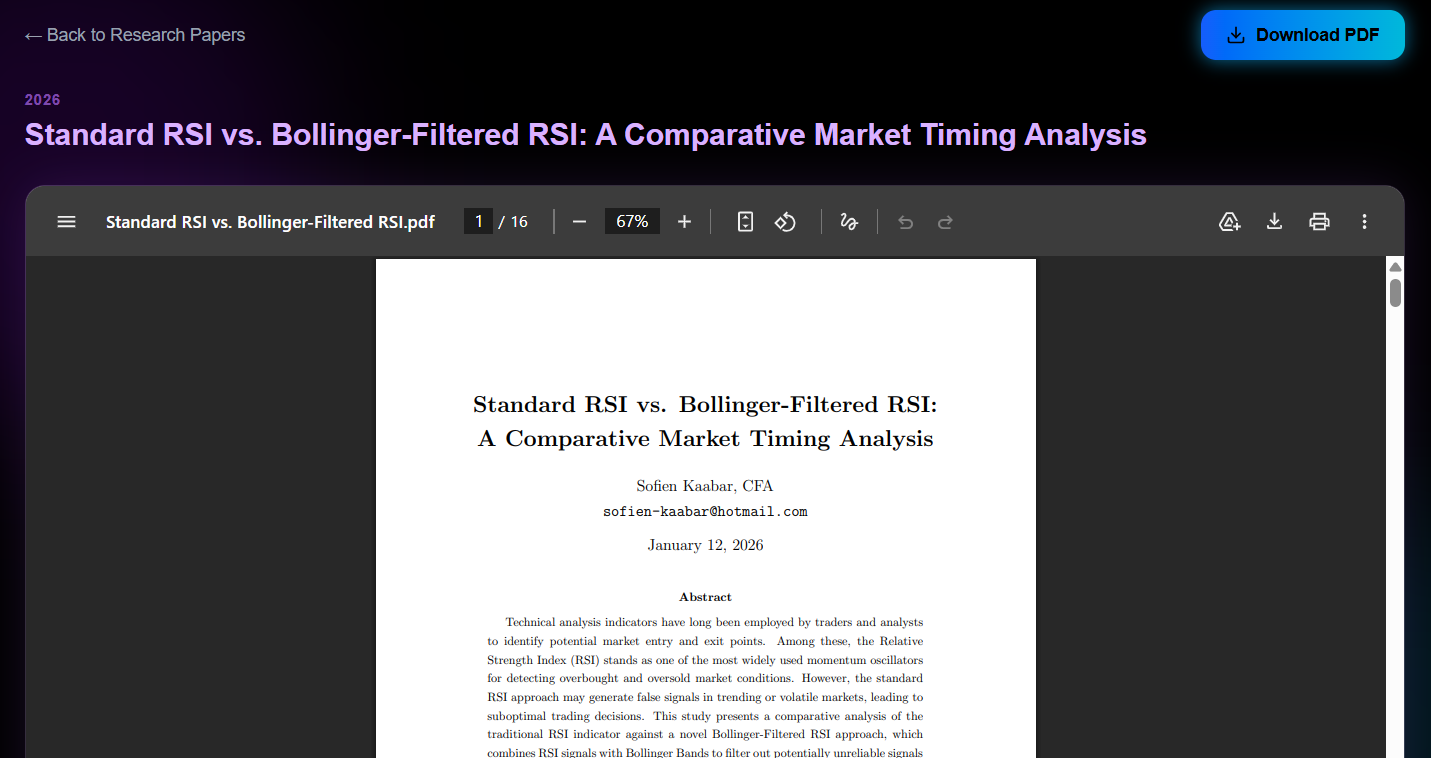
Head over to quant-atlas.com/research to check out our selection (Free and always will be).
Why You NEED Quant Atlas
Quant Atlas provide timely forecasts for 100+ global assets (FX, EM, IX, cryptos, stocks, rates, and commodities). Forecasts are ranked by conviction, and strong conviction views are pushed onto subscribers through a notification system.
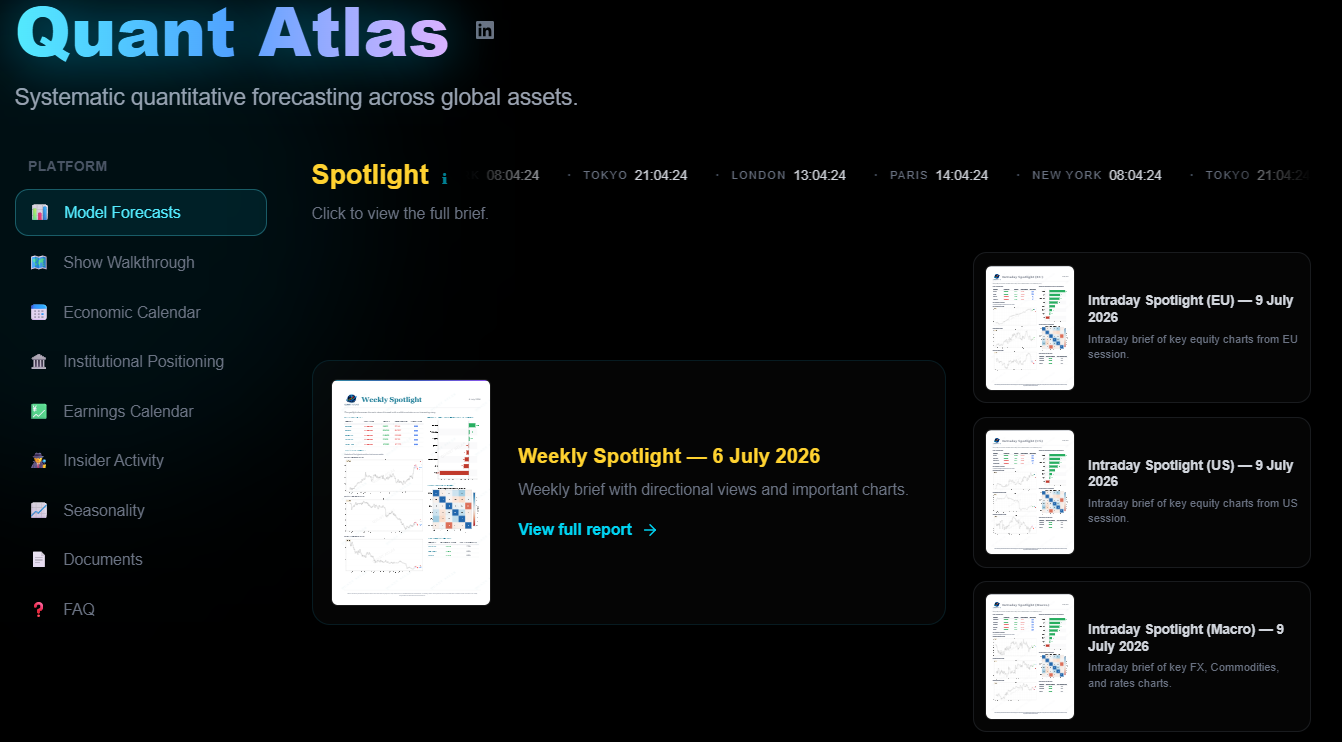
Forecasts are published on the website in the form of charts.
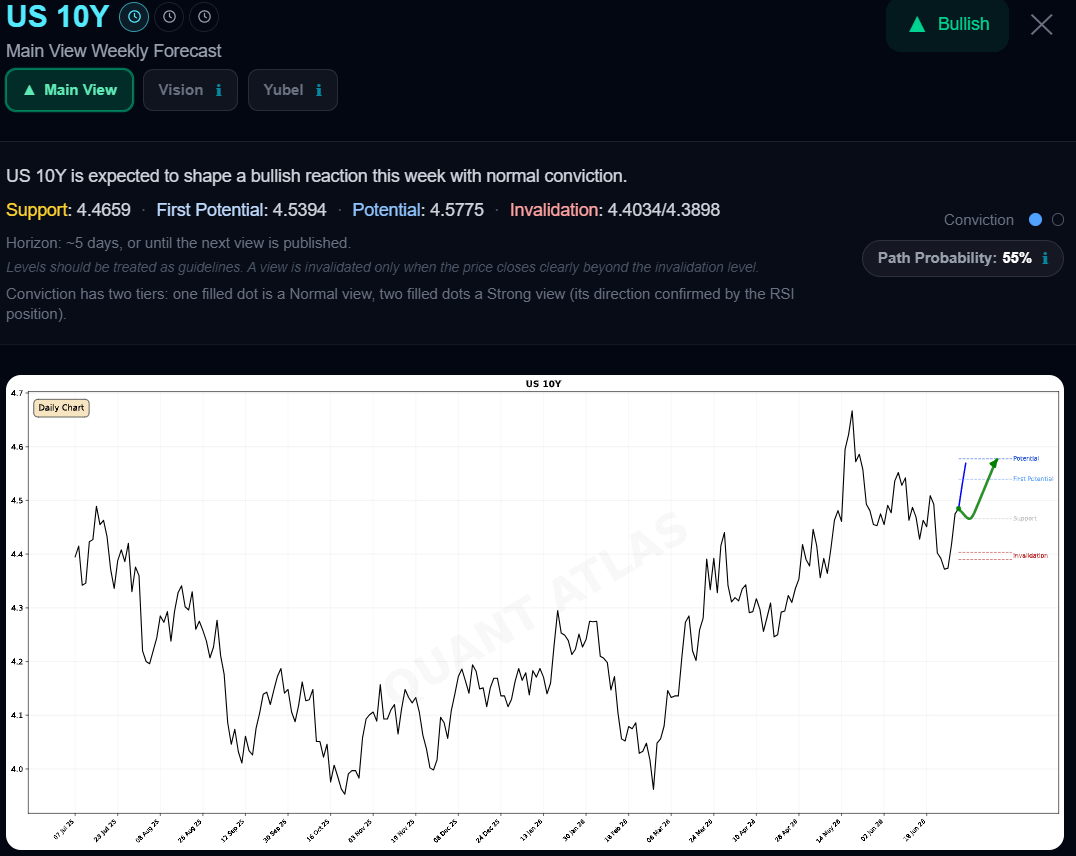
A strong conviction view is represented by two full blue dots as illustrated in the following example.
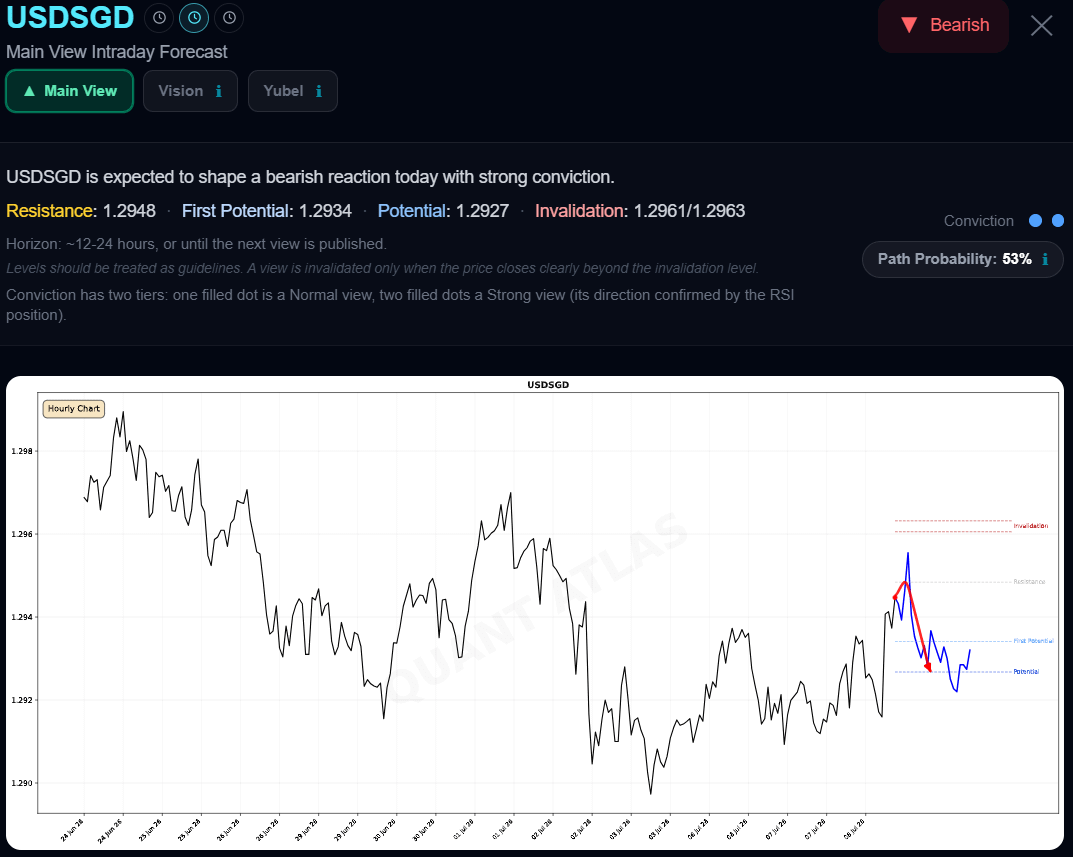
Charts are updated after the forecast to reflect the evolution of price. This allows subscribers to evaluate the forecast. You can also view past charts to evaluate past forecasts.
There are two types of time horizons. We publish Weekly views (once per week on Mondays with a forecasting life span of around 5 days) and Intraday views (once per day with a forecasting life span of 12-24 hours). Weekly views use Daily bars in the charts and Intraday views use Hourly bars in the charts.
The frequency of publication is regular. Weekly views are published early in the morning NY time and intraday views are published around 7:00 AM NY time every day.
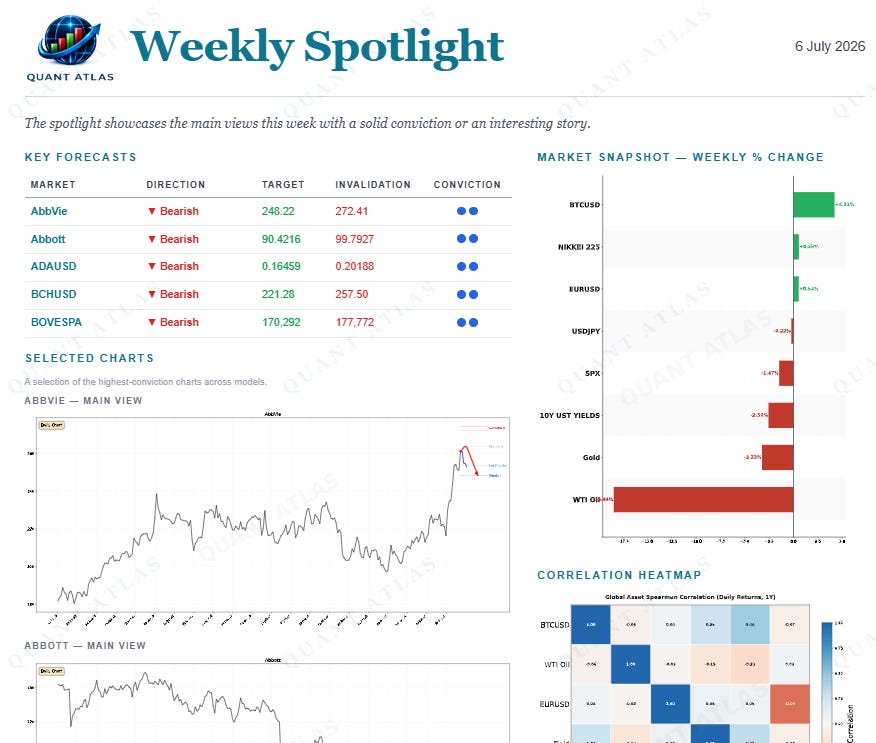
The Spotlight summarizes the views and shows some interesting charts. It’s a quick read if you don’t have enough time to go through the whole list of markets.
You will also find market intelligence tools on the website such as:
Institutional positioning,
Insider activity,
Earnings calendar,
Seasonality tables,